FROM THE SUN TO EARTH
Watch solar storms
cross space, live.
Every NASA-catalogued eruption drawn at its measured direction and speed, Sun to Earth. Scrub it in time, fly it in 3D, run the solar wind as a fluid, and watch Earth's magnetic shield respond. Arrival forecasts, storm alerts, and replays back to 1859.
The map is live. The other three are captured from the tracker every night.
THE CURRENT OUTLOOK
Checking space weather…
The latest readings and arrival estimates will appear here.
THE SUN RIGHT NOW
This is not an illustration.
NASA's Solar Dynamics Observatory photographs the Sun every few minutes. This is its latest hour: the surface where sunspots show as dark specks, the corona at a million degrees, and the chromosphere where prominences erupt. Every CME on the map started somewhere in this picture.
Today: —
Where are we in the solar cycle? →Forecasts tested against real arrivals.
Read the results, including the misses →
Built on real spacecraft data
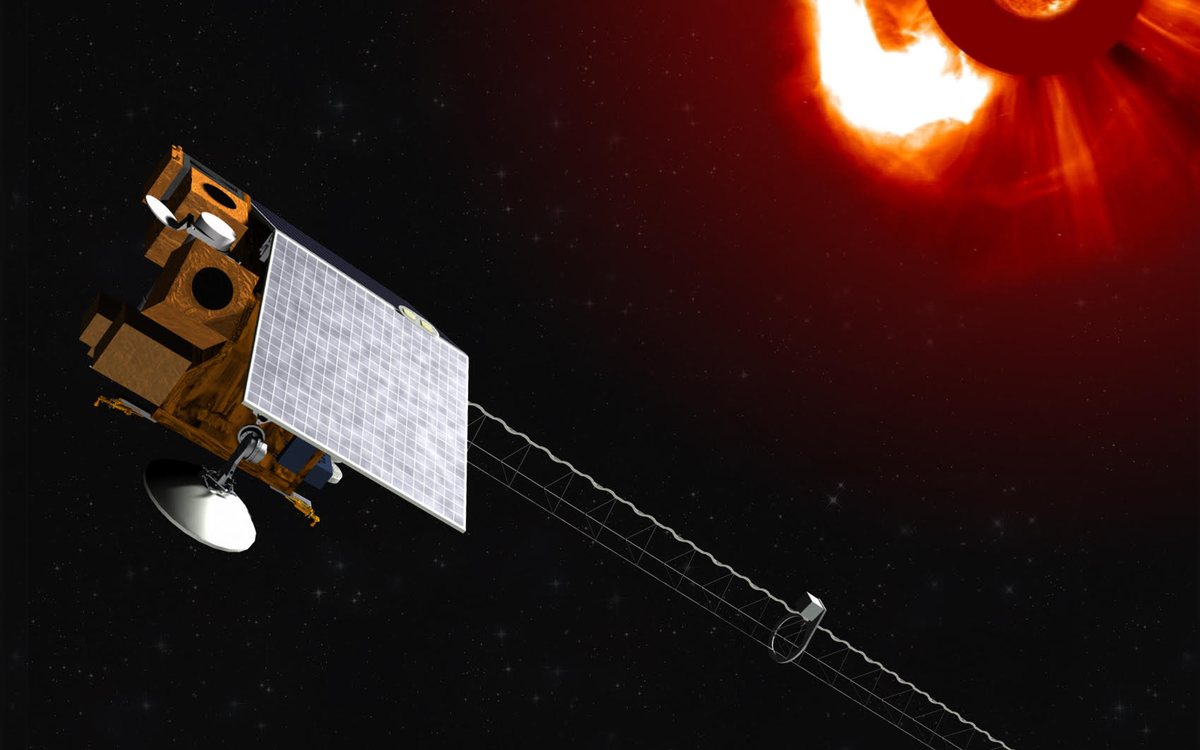
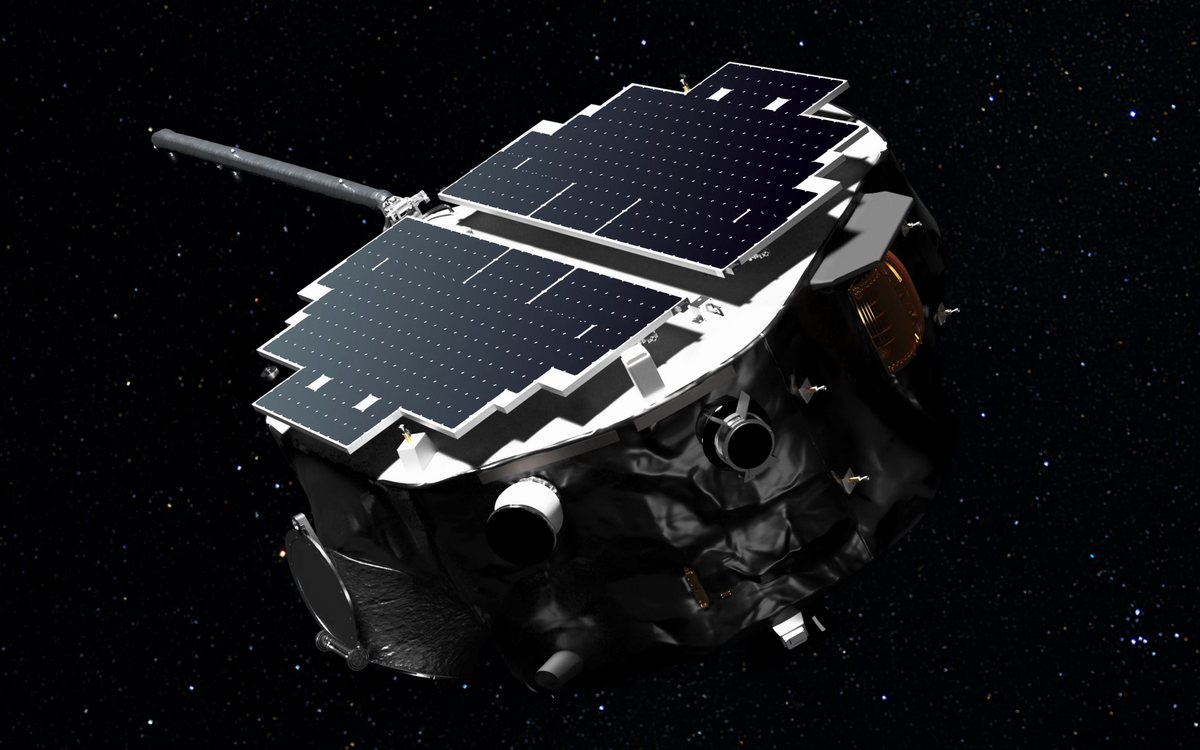
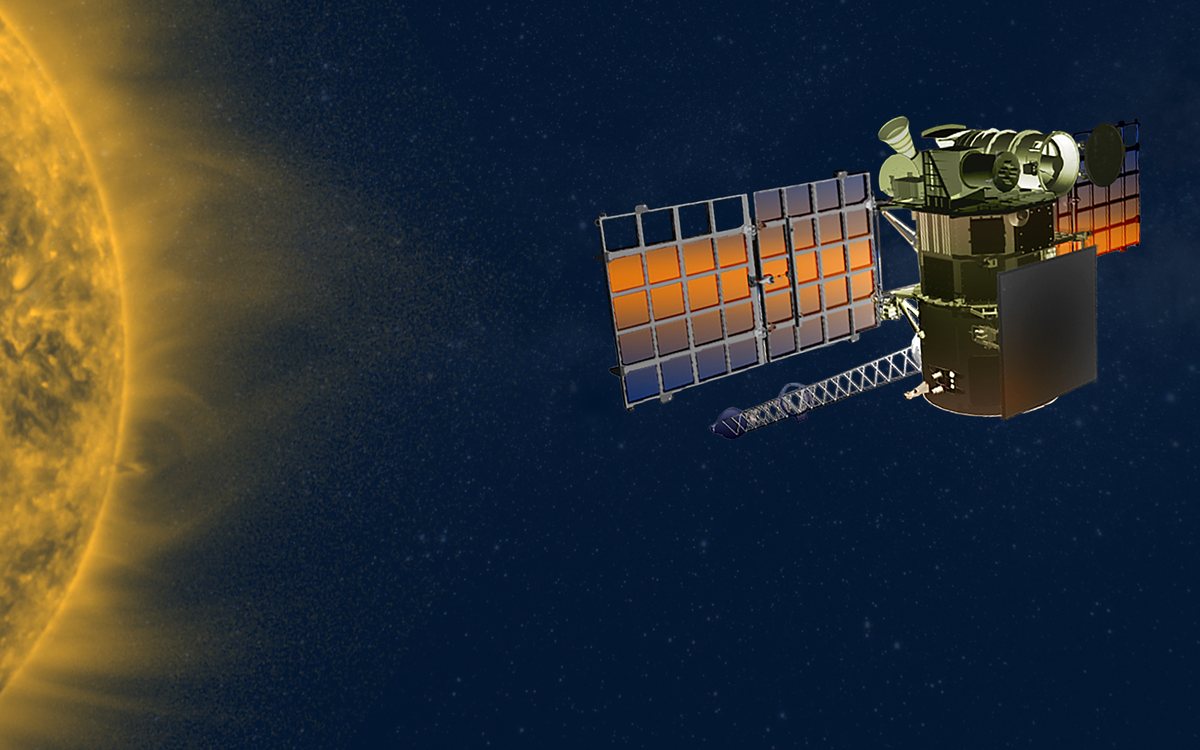
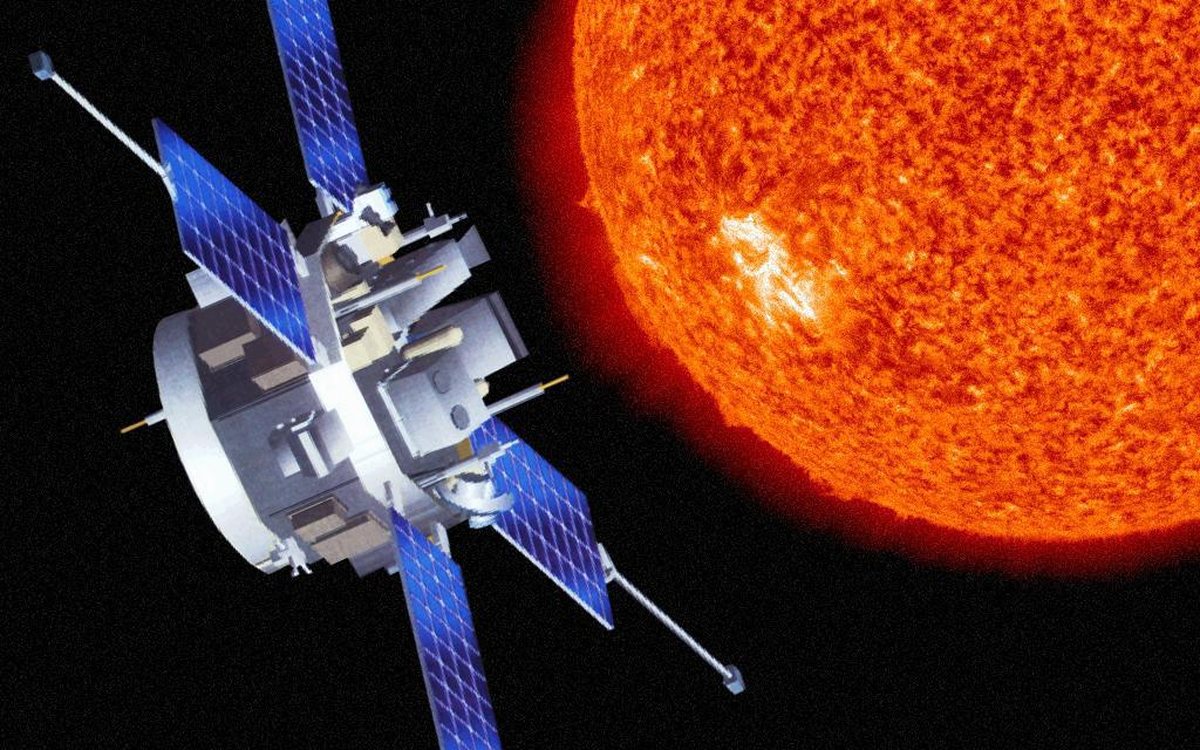
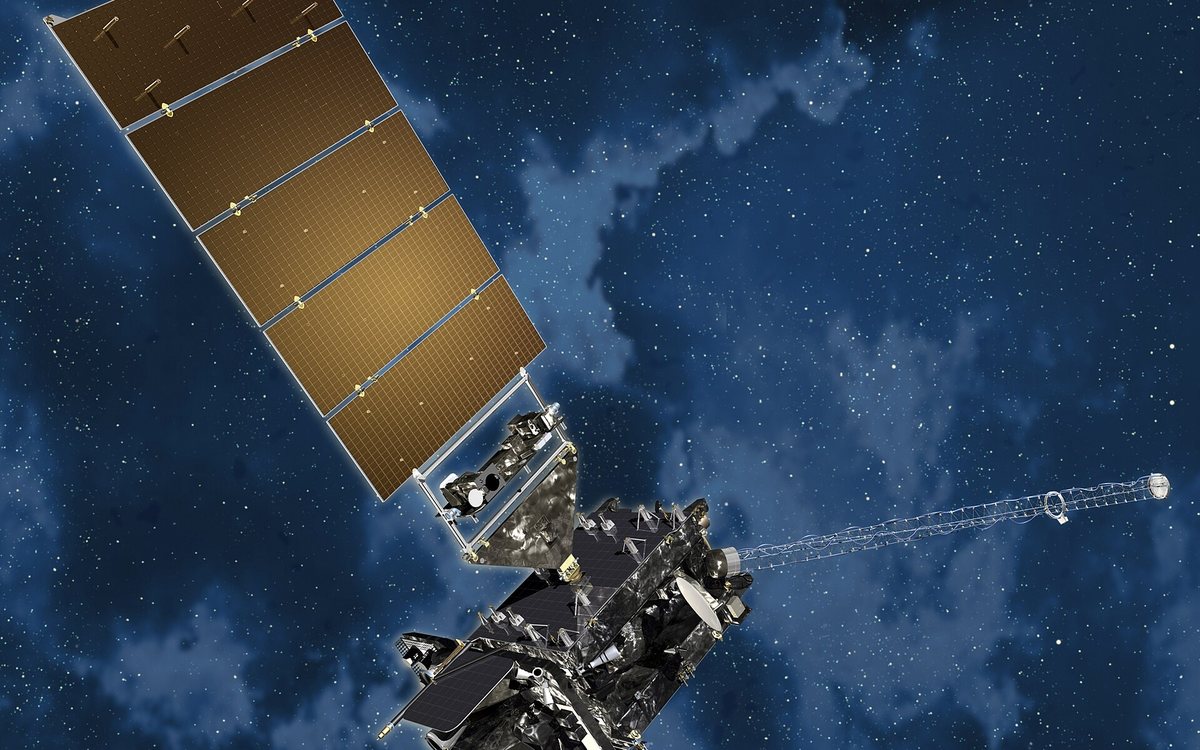
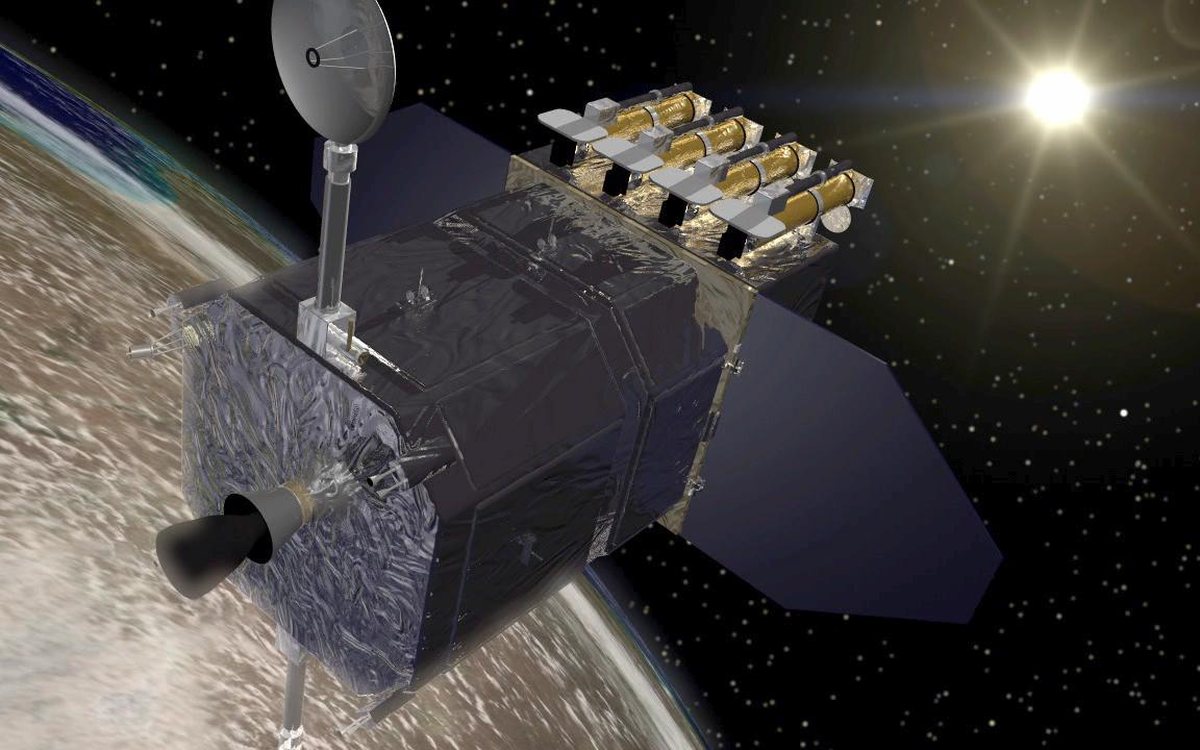
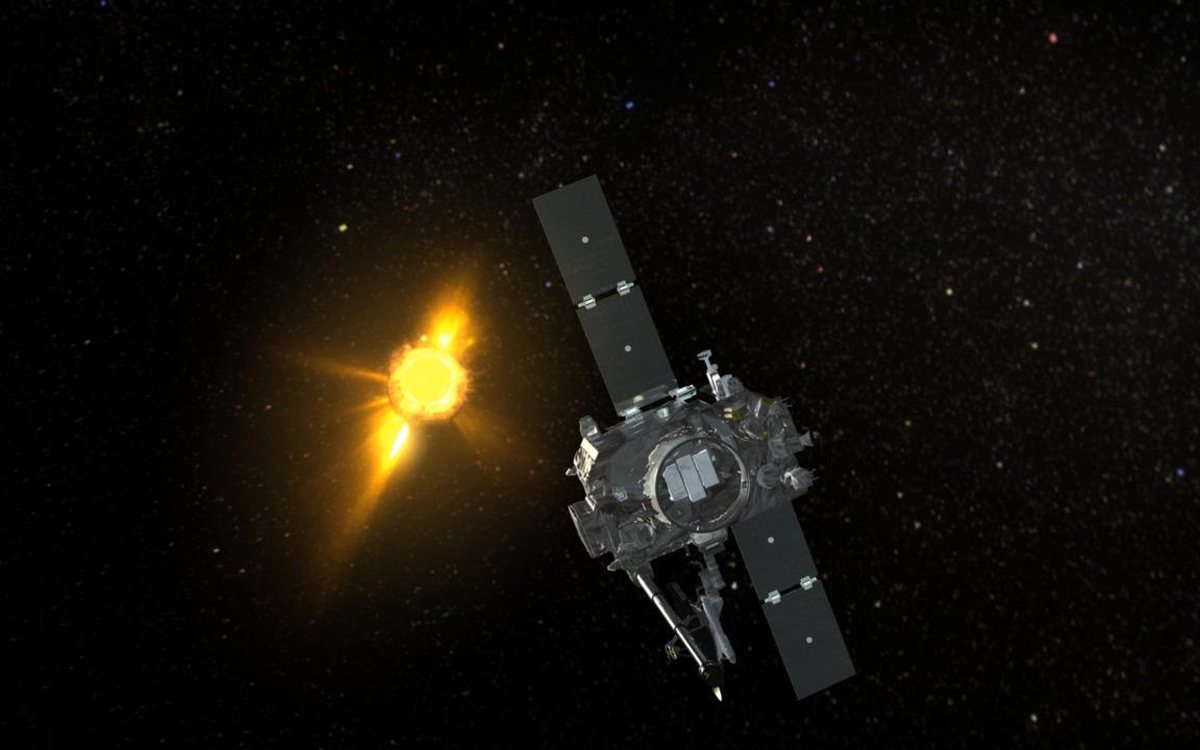
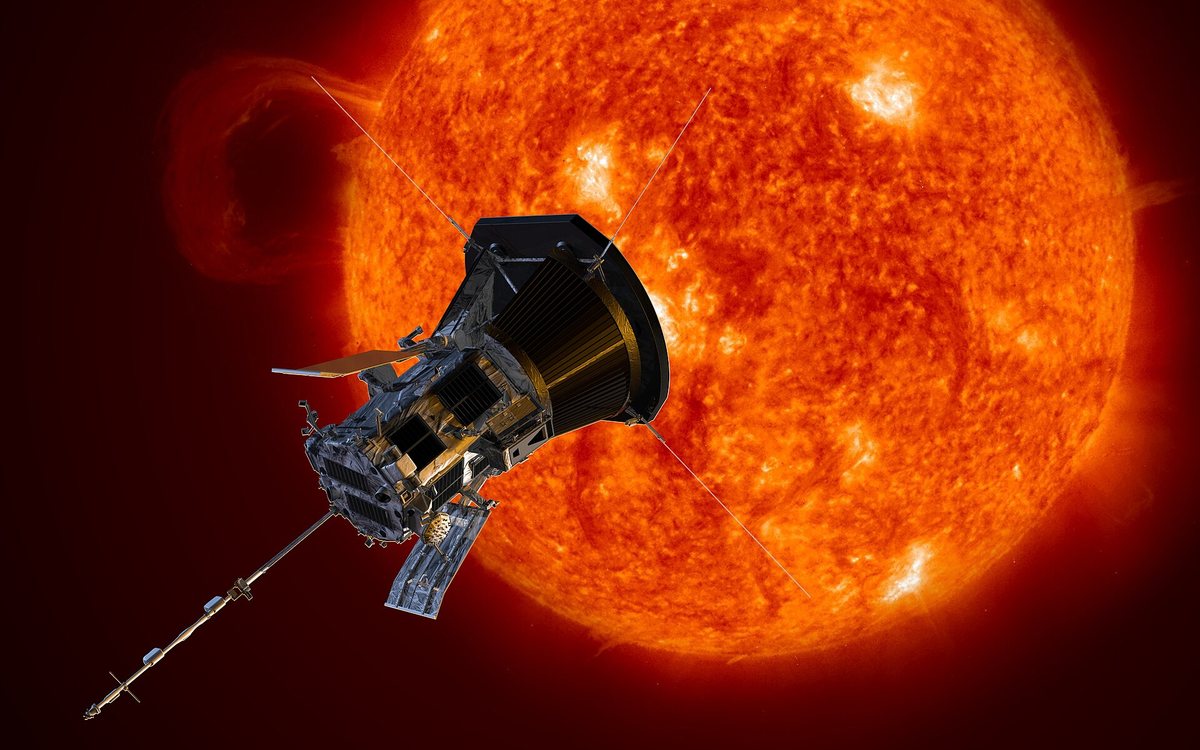
Powered by NASA, NOAA, and ESA observations. Meet the spacecraft behind the map.
What each spacecraft measures →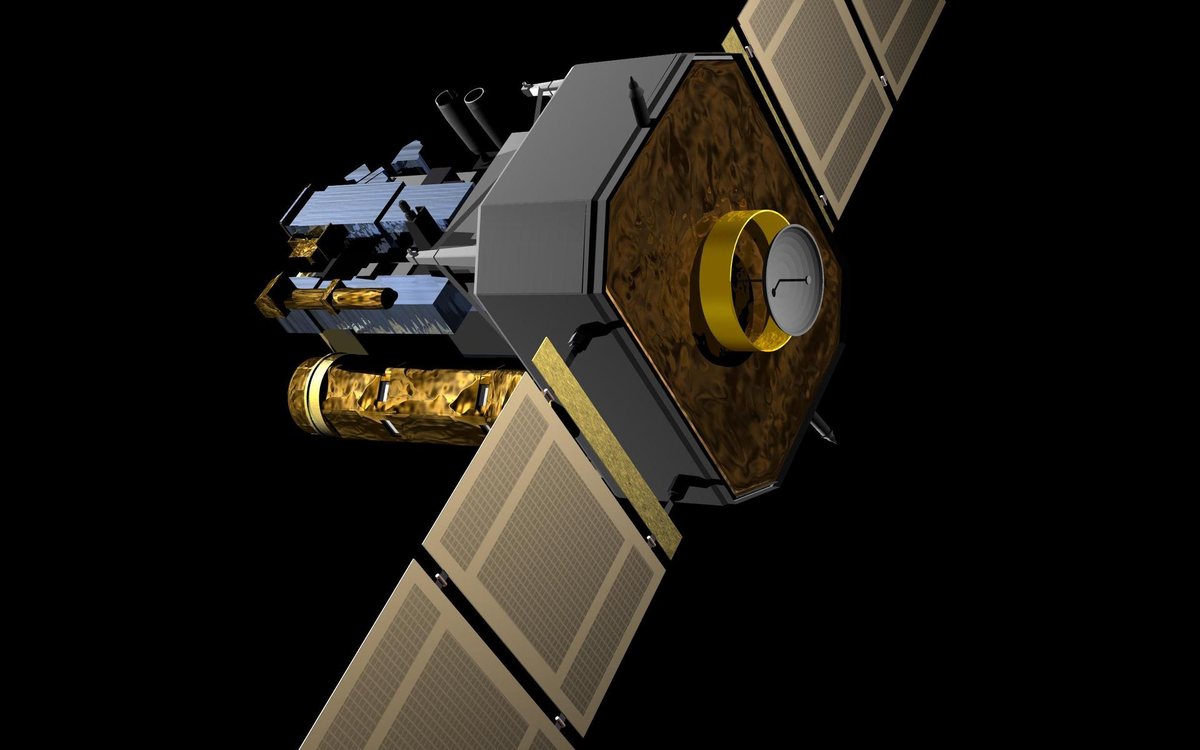
SEE HOW A STORM UNFOLDS
Replay the Gannon Storm.
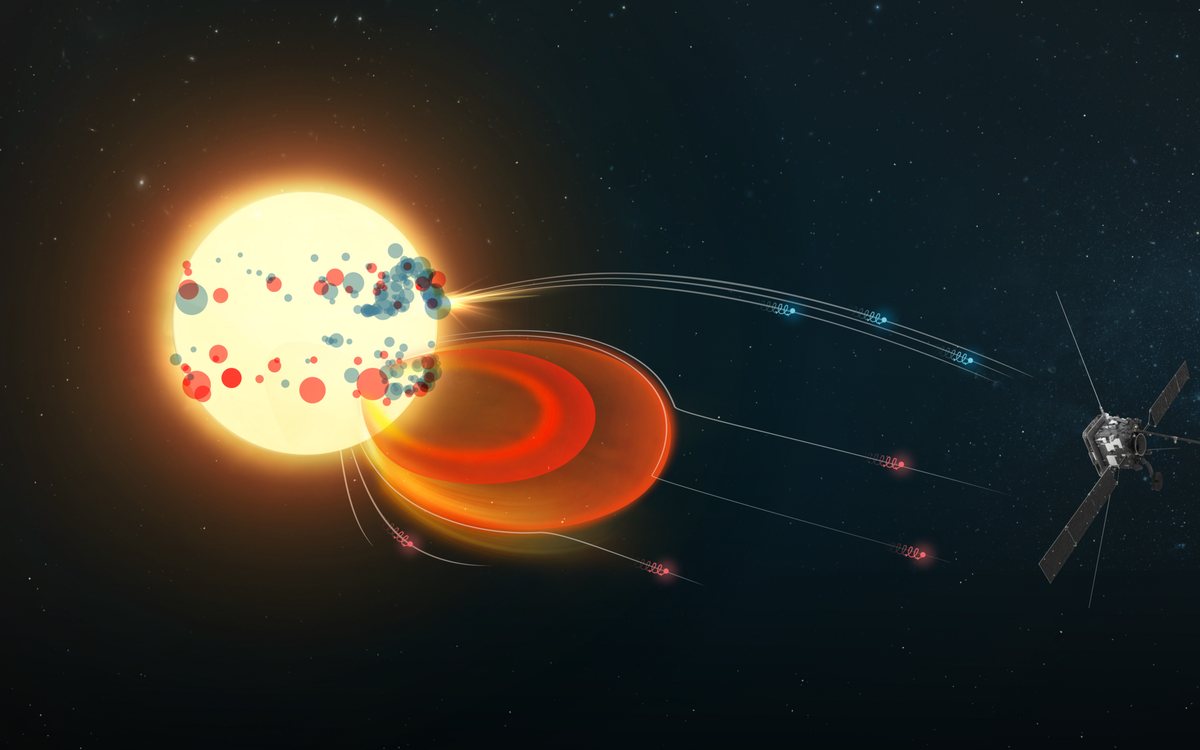
A barrage of CMEs. A planet-wide storm. Follow the May 2024 eruptions from the Sun to Earth, then scrub through their arrivals.
Start the replay →More famous storms →DON’T MISS THE NEXT ONE
A heads-up. Then a go-now.
Free aurora alerts: an early warning when a significant Earth-directed CME launches, followed by a confirmation from the L1 monitor.
Check tonight’s aurora outlook →FOR STUDENTS AND TEACHERS
Learn it on the real thing.
A free six-module course that runs on this map: click today's newest CME, replay the 2024 superstorm and call its arrival, move the solar wind and watch the forecast move. About 40 minutes, no account. Teachers get three ready lesson plans with worksheets and answer keys, and the famous-storm pages read like history and each end in a replay you can scrub.
Explore more
Choose your next view.A few good questions
How long does a CME take to reach Earth?
Typically one to three days, depending on how fast it left the Sun — slow CMEs amble at ~350 km/s while extreme ones exceed 2,000 km/s. The fastest transit on record is about 17 hours, during the 1859 Carrington Event.
How accurate are CME arrival predictions?
Our published back-test reports a median absolute arrival error of 12.3 hours across 282 arrivals. That is a historical error statistic, not a guarantee or a confidence interval for an individual forecast. The science page publishes the whole scoreboard, misses included.
Will I see the aurora tonight?
It depends on tonight's geomagnetic activity (the Kp index) and how far you are from the pole — plus dark skies and the Moon. The Aurora tonight page gives a live answer for your location, city by city.
What's the difference between a solar flare and a CME?
A flare is a burst of light and X-rays that reaches Earth in 8 minutes and can black out radio; a CME is a billion-ton cloud of magnetized plasma that arrives one to three days later and causes geomagnetic storms and aurora. Big eruptions often produce both — the tracker shows flares flashing at the Sun and the CMEs they launched.
Can a solar storm damage the power grid or the internet?
Extreme ones can: the March 1989 storm collapsed Québec's power grid in 92 seconds, and a Carrington-class storm today would be a genuine infrastructure event. Ordinary storms — the kind that happen monthly — mostly mean aurora, minor satellite drag, and GPS wobble, not blackouts.
I'm a student or teacher — where should I start?
Take the six-module course: each module puts the live map on the page with one thing to do, and teachers get three ready lesson plans. Or start with a story: the famous storms pages read like history and each ends with a replay you can scrub — the Carrington Event and the Almost-War Storm are class favorites. Then the plain-English guide explains every number on the live map. Everything here is free, no account, and the estimates are honest about their error bars — which makes it useful for teaching how real forecasting works.
What does the Kp index mean?
Kp measures global geomagnetic disturbance on a 0–9 scale, updated every three hours; storms start at Kp 5 (NOAA scale G1) and the rare extreme G5 storms reach Kp 9. The guide explains every scale the site uses.