CME TRACKER
Home › The spacecraft
Where the data comes from

The spacecraft behind CME Tracker

Nothing on this site is made up. Every CME on the map, every wind speed in the header, every flare and every solar image was measured by one of the spacecraft below, most of them run by NASA, NOAA and ESA and shared freely with anyone who asks. Here is what each one does, in plain English, and which part of the site it feeds.

Show them on the live map →
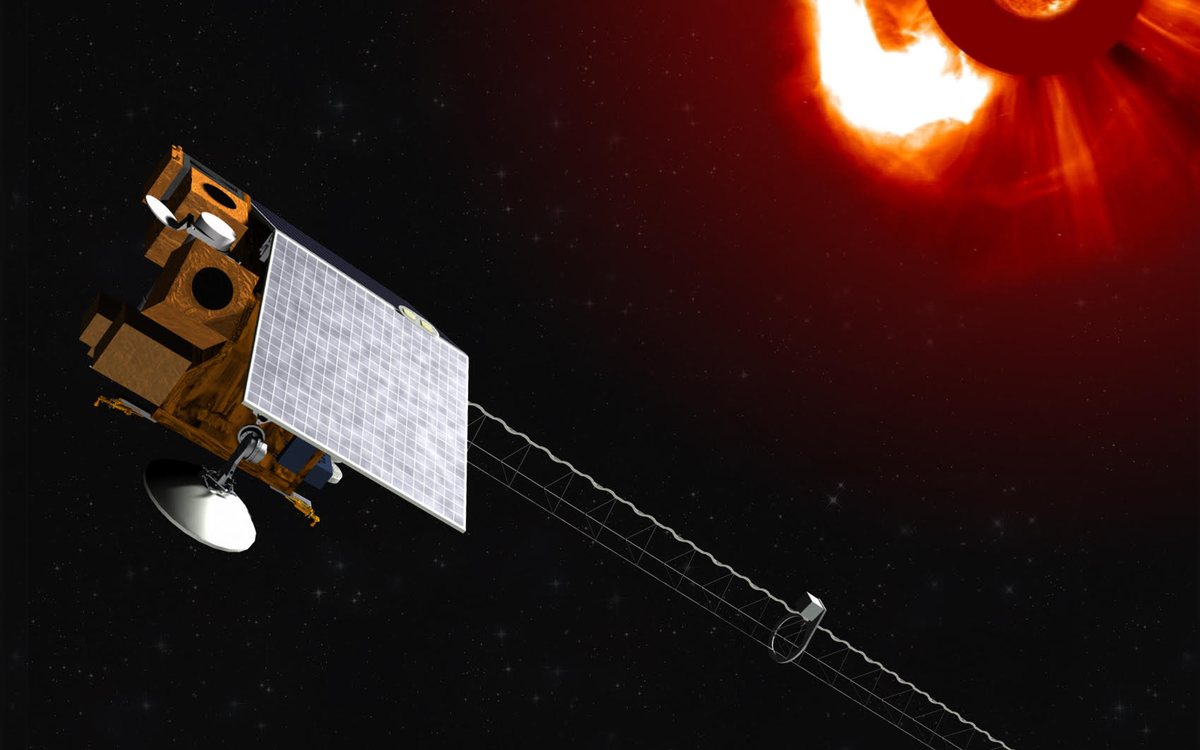
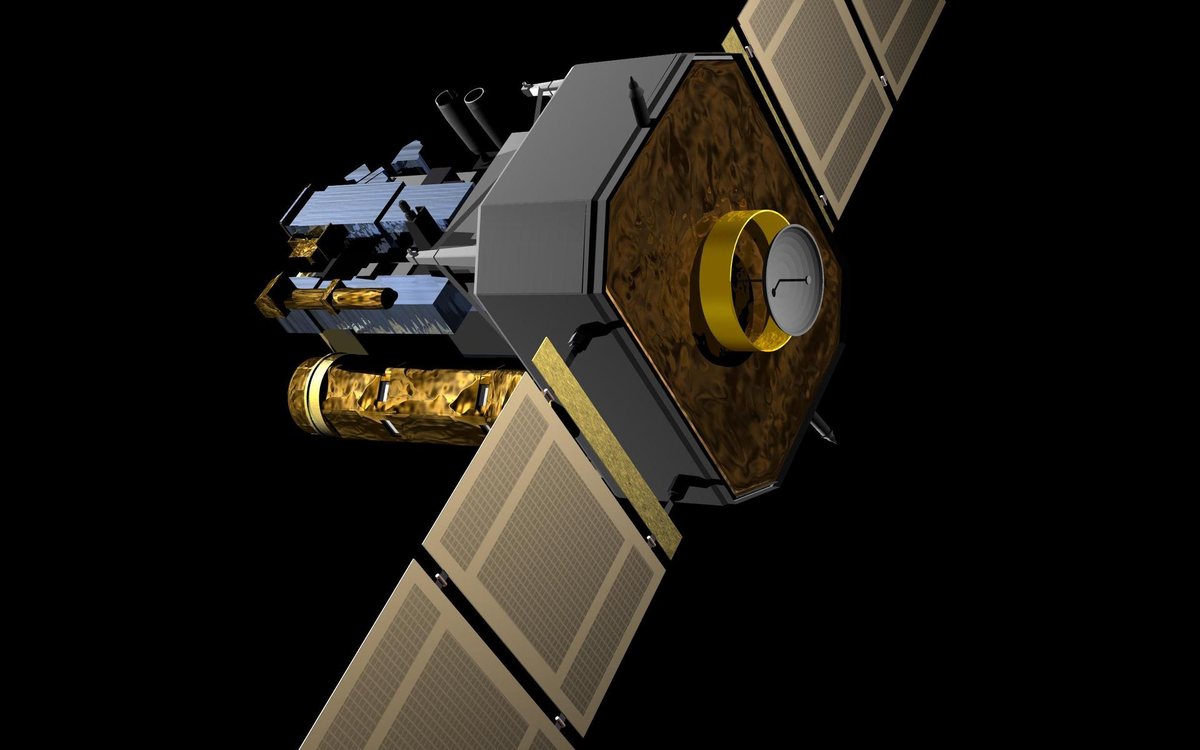
Artist's rendering of the SOHO spacecraft with its solar panels deployed

SOHO

ESA / NASA · launched 1995
Sun–Earth L1, about 1.5 million km sunward of Earth

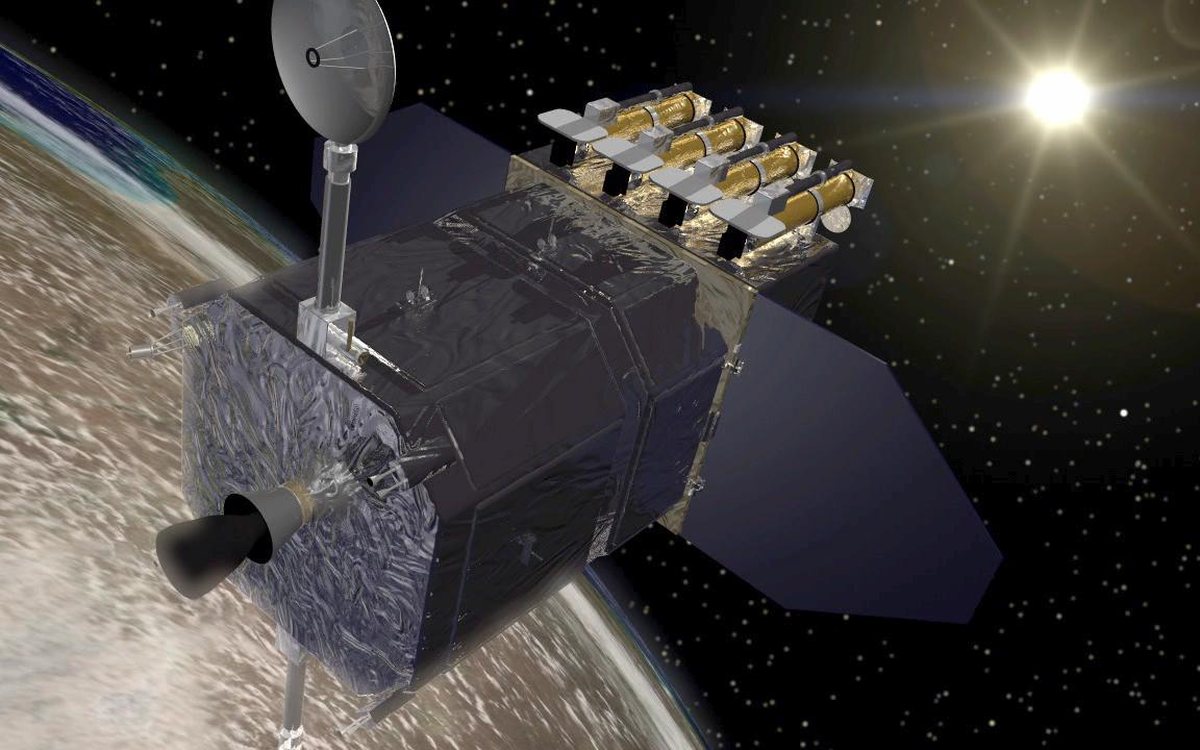
The Solar and Heliospheric Observatory is the grandfather of the fleet. Designed for a two year mission, it has now watched the Sun for three decades. Its LASCO coronagraphs block out the Sun's disk with a small occulting disk, the way you'd block the Sun with your thumb, so the faint outer atmosphere becomes visible. That is where CMEs are first seen: a bright cloud leaving the Sun at hundreds or thousands of kilometers per second.

Feeds: the CME catalog. NASA's analysts measure each CME's speed, direction and width from LASCO images, and that measurement is what launches every cone you see on the map.
Artist's rendering. Credit: ESA/NASA/SOHO via images.nasa.gov
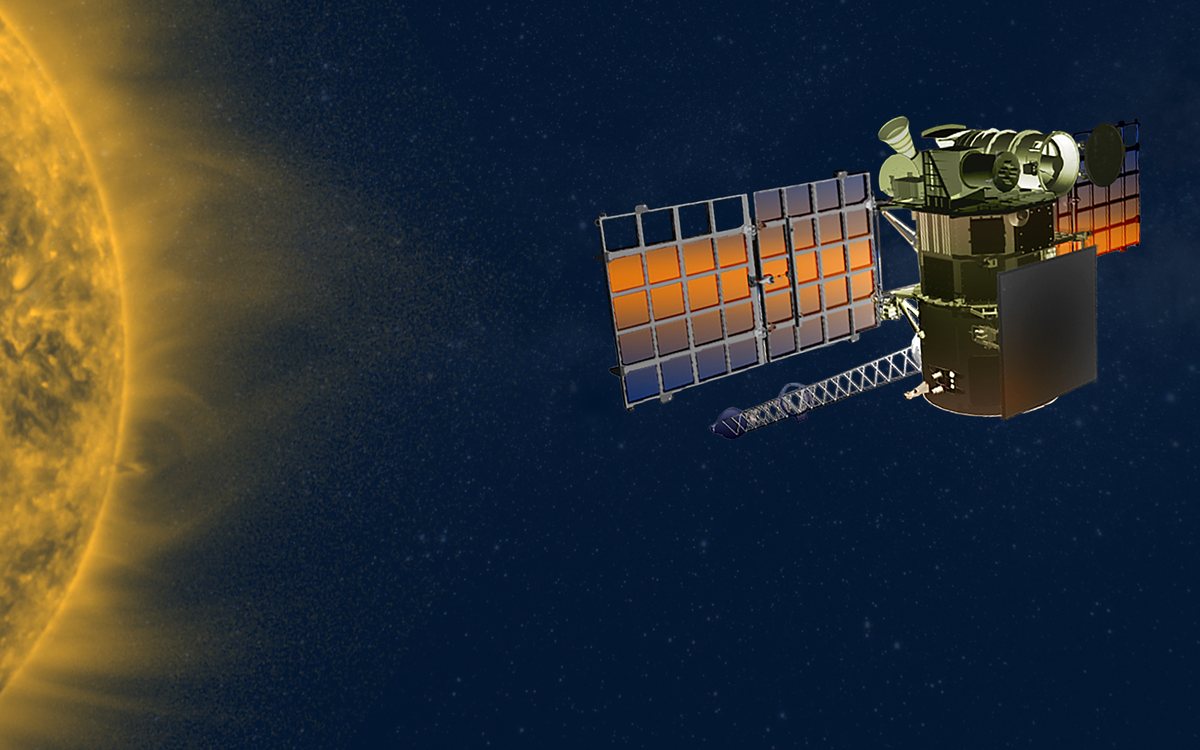
Rendering of the DSCOVR spacecraft in space with the Sun in the background

DSCOVR

NOAA · launched 2015 · retired from real-time duty 2026
Sun–Earth L1, upstream of Earth by about an hour of solar wind

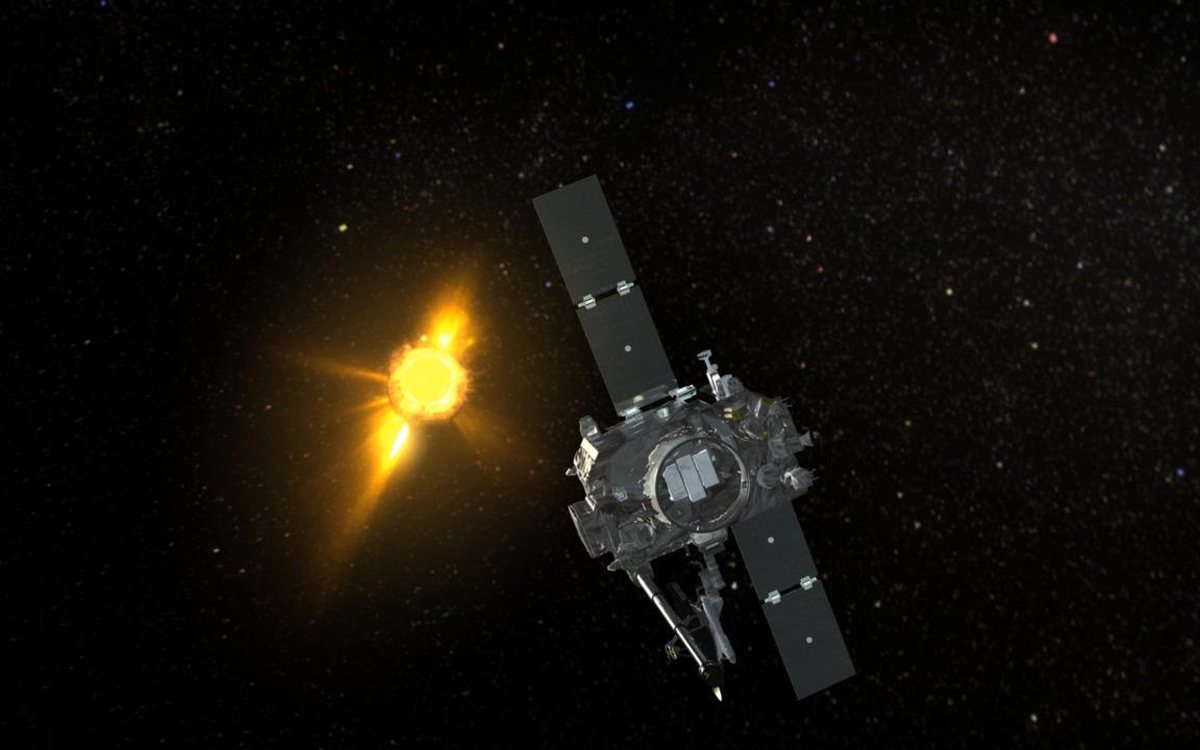
For a decade the Deep Space Climate Observatory was the craft the world watched for storms. It sits in the solar wind's path and simply reports what is flowing past: how fast, how dense, and which way the magnetic field is pointing. Because it's a million miles upstream, its readings arrive 30 to 60 minutes before the same wind hits Earth. That hour is the entire basis of short term storm warnings. In 2026 NOAA handed that job to SOLAR-1; DSCOVR is still at L1.

Fed: the live wind, density and Bz from 2016 until spring 2026, so most of our wind archive and every replay from that decade is DSCOVR's measurement. Its live role now belongs to SOLAR-1, below.
Rendering. Credit: NOAA, public domain, via Wikimedia Commons
Rendering of NOAA's SOLAR-1 (SWFO-L1) spacecraft with its magnetometer boom extended and an erupting Sun behind

SOLAR-1

NOAA · launched 2025 as SWFO-L1
Sun–Earth L1, on station since January 2026

NOAA's first satellite built purely for space weather. It launched in September 2025 sharing a rocket with IMAP, reached L1 in January 2026, and after checkout took over from DSCOVR as the operational solar wind monitor in the spring. It carries the same kind of instruments as its predecessors, a plasma sensor and a magnetometer, plus two things DSCOVR never had: an energetic particle detector and CCOR-2, a compact coronagraph, so a single craft can now both see a CME leave the Sun and feel it arrive.

Feeds: the live solar wind, density and Bz readouts in the header, the L1 nowcast card, the wind chart, and the archive behind the Streams layer. When a CME's shock hits SOLAR-1, that's the "arriving now" signal in your alert email. The nowcast card names it when it's on duty.
Rendering. Credit: NOAA, public domain, via Wikimedia Commons
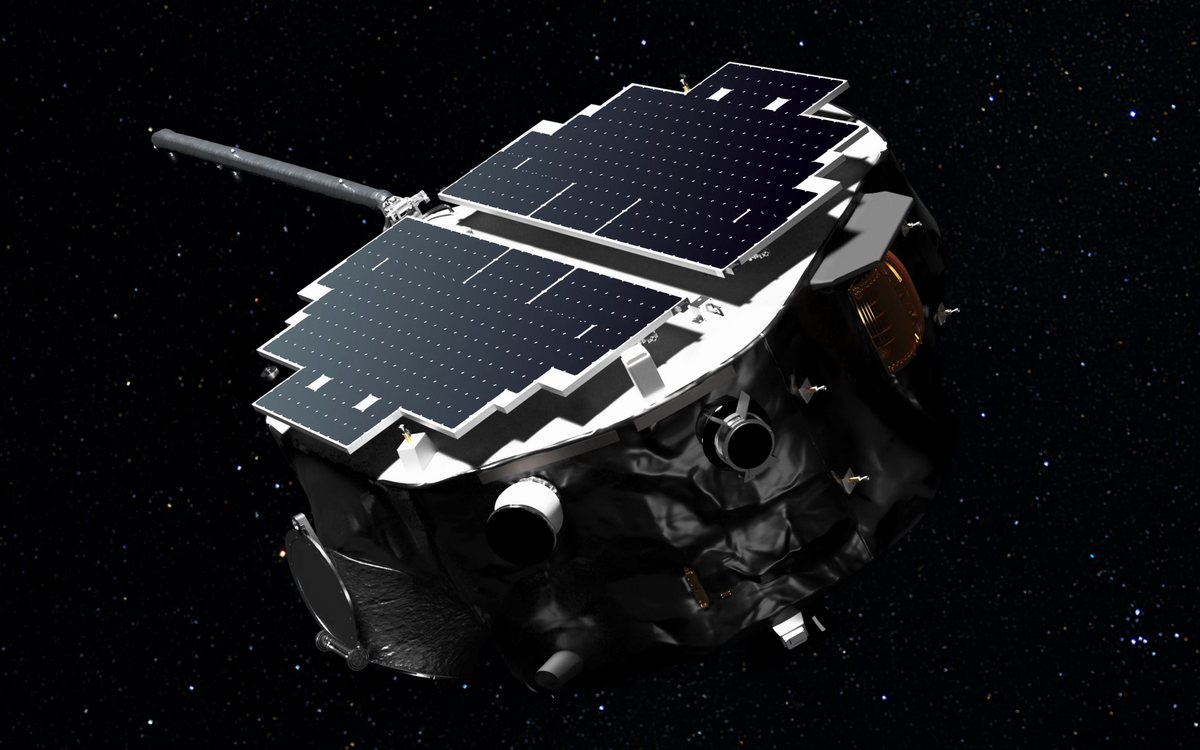
Rendering of NASA's IMAP spacecraft, a flat drum covered in solar cells with a long magnetometer boom

IMAP

NASA · launched 2025
Sun–Earth L1, alongside SOLAR-1

The Interstellar Mapping and Acceleration Probe's main job is far bigger than Earth: it maps the boundary where the Sun's wind meets interstellar space, by catching neutral atoms that drift in from the edge of the heliosphere. But it sits at L1 with a full set of solar wind and particle instruments, and NASA built it a real time data stream specifically so forecasters could use it. That makes it the first science mission designed from the start to double as a space weather sentinel.

Feeds: NOAA streams IMAP's wind and magnetic field alongside SOLAR-1's as a backup, so if SOLAR-1 drops out the header and nowcast fall over to IMAP automatically. Its particle data is a candidate for the radiation card.
Rendering. Credit: NASA/Princeton/Patrick McPike, public domain, via Wikimedia Commons
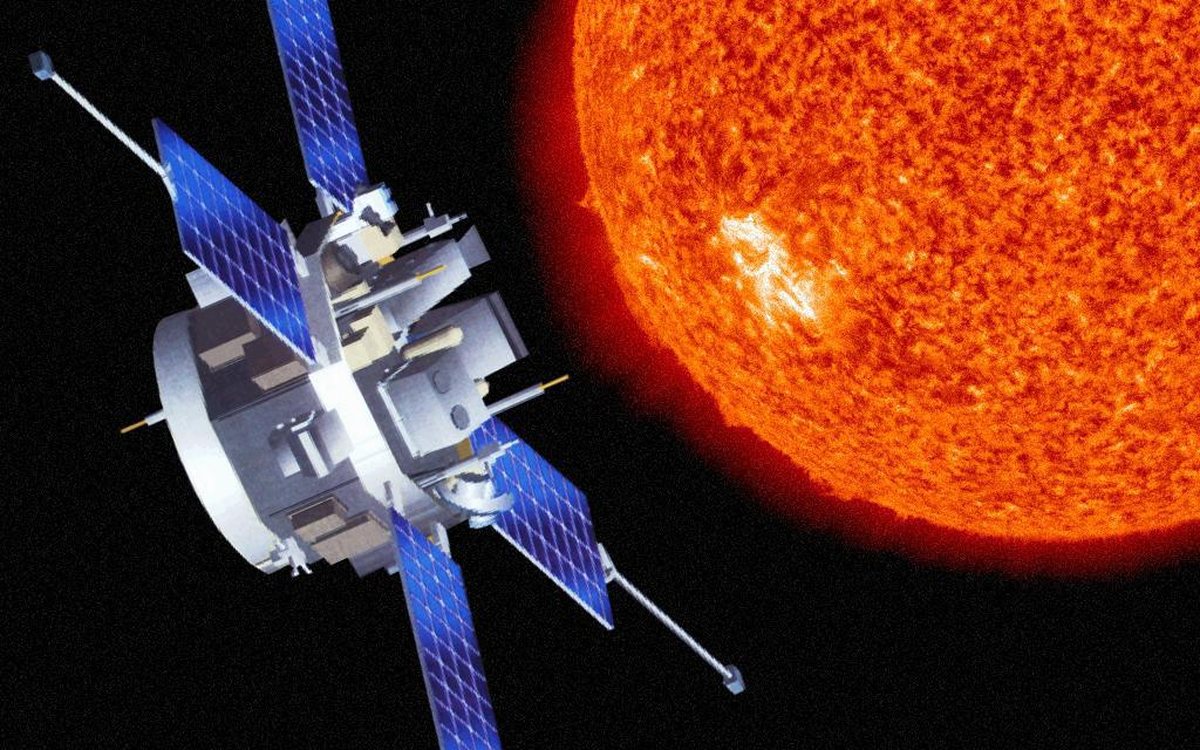
Artist's rendering of the ACE spacecraft with the Sun at right

ACE

NASA · launched 1997
Sun–Earth L1, alongside DSCOVR and SOHO

The Advanced Composition Explorer was built to study what the solar wind is made of, atom by atom, but it became famous for something else: for eighteen years it was the world's real time solar wind monitor, the craft whose readings NOAA watched to see storms coming. DSCOVR took over that job in 2016 and SOLAR-1 in 2026. ACE is still flying, nearly thirty years on, and still streams as a backup.

Feeds: the same wind and magnetic field numbers as SOLAR-1, whenever NOAA switches the live feed over to it. The L1 nowcast card tells you which craft is on duty.
Artist's rendering. Credit: NASA via images.nasa.gov
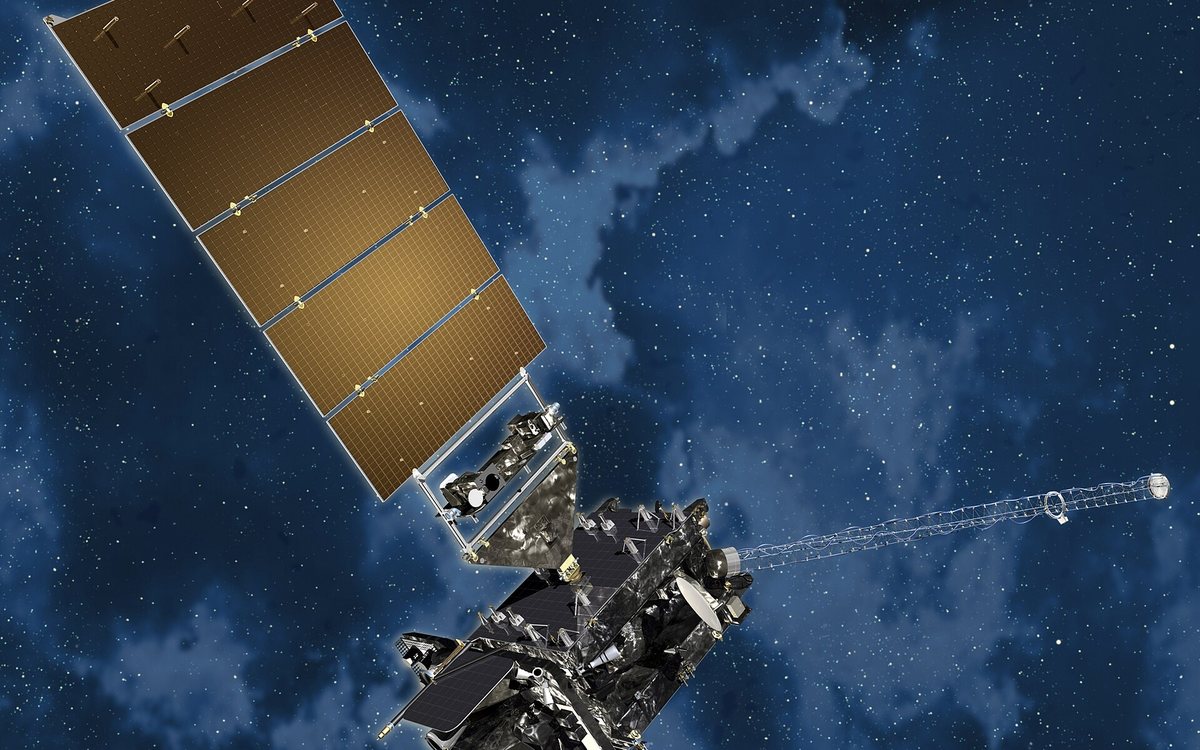
Rendering of a GOES-R series weather satellite against the night sky

GOES

NOAA · series since 1975
Geostationary orbit, 35,800 km above the equator

The GOES satellites are the weather satellites behind every hurricane image on the news, and they carry a second set of eyes pointed at the Sun. An X-ray sensor measures the Sun's X-ray brightness every second; when it spikes, that's a solar flare, and its height gives the flare its class (C, M or X). Particle detectors count the protons that arrive after big flares, the radiation storms that matter to astronauts and airline crews over the poles.

Feeds: the flare list and flare classes, the Solar flares map layer, the R-scale radio blackout status, and the S-scale radiation card. The proton counts also drive the "SEP observed" flag on a CME's connectivity line.
Rendering. Credit: NOAA, public domain, via Wikimedia Commons
Artist's rendering of the Solar Dynamics Observatory above Earth

SDO

NASA · launched 2010
Inclined geosynchronous orbit, in constant contact with one ground station

The Solar Dynamics Observatory is the Sun's portrait photographer. It takes a full disk image every 12 seconds in ten wavelengths, from visible light (where you see sunspots) to extreme ultraviolet (where you see the million degree corona, loops of magnetic field, and flares as they erupt). It sends home more data every day than most missions do in their lifetime.

Feeds: the Sun panel in the tracker, which shows the SDO frame from whatever moment the timeline is set to, and the "Sun right now" image on the homepage. When you replay the Gannon storm and watch the flares fire, you are watching SDO's pictures.
Artist's rendering. Credit: NASA/GSFC via images.nasa.gov
Artist's rendering of STEREO-A observing an eruption on the Sun

STEREO-A

NASA · launched 2006
Orbiting the Sun on its own, drifting around Earth's orbit

A coronagraph on the Earth side of the Sun has a problem: a CME coming straight at us looks like a ring growing in all directions, and you can't tell how fast it's really moving toward you. STEREO-A solves this by looking from the side. It's on its own orbit around the Sun, slowly lapping Earth, so it sees the same CME from a different angle. Two angles give you the true direction and speed. Its twin, STEREO-B, was lost in 2014.

Feeds: the second viewpoint NASA's analysts use to pin down each CME's true direction and width, which is what decides whether a cone on this map points at Earth. Its position is drawn on the Spacecraft layer with a sightline to the Sun.
Artist's rendering. Credit: NASA/GSFC via images.nasa.gov
Artist's rendering of Parker Solar Probe close to the Sun, heat shield forward

Parker Solar Probe

NASA · launched 2018
Diving to within 6 million km of the Sun's surface every 88 days

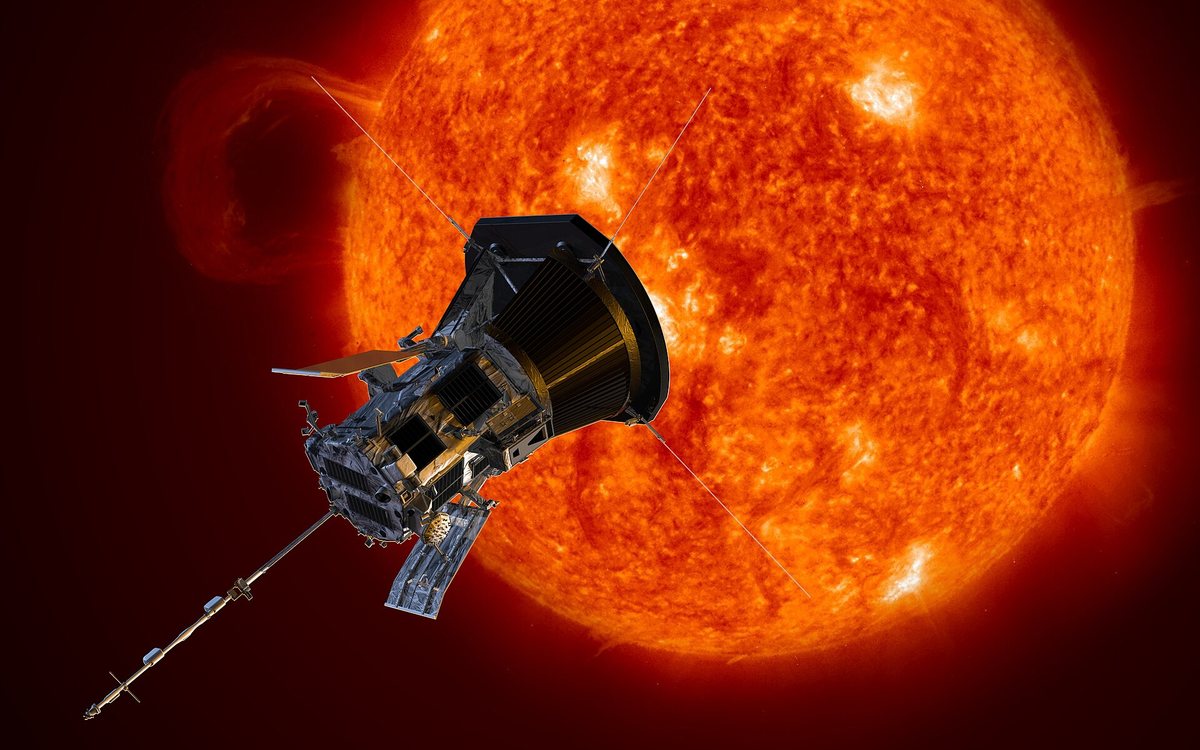
Parker is the fastest object humans have ever built, and the first to fly through the Sun's corona. Its closest passes bring it inside 10 solar radii, where it's protected by a carbon foam shield that faces 1,400°C while the instruments behind it sit near room temperature. It samples the solar wind at its birthplace, before it has had time to mix and cool, which is how we're learning why the wind is fast in some places and slow in others.

Feeds: nothing live, and that's on purpose. Parker's data comes down in batches weeks later. It's on the map (Spacecraft layer, plotted from its real orbit) so you can see when a CME sweeps past it, and because it's where the science that makes tomorrow's forecasts better is being done.
Artist's rendering. Credit: NASA/Johns Hopkins APL/Steve Gribben, public domain, via Wikimedia Commons
Illustration of Solar Orbiter near the Sun with a CME and particle paths

Solar Orbiter

ESA / NASA · launched 2020
Inside Mercury's orbit at closest approach, climbing toward the Sun's poles

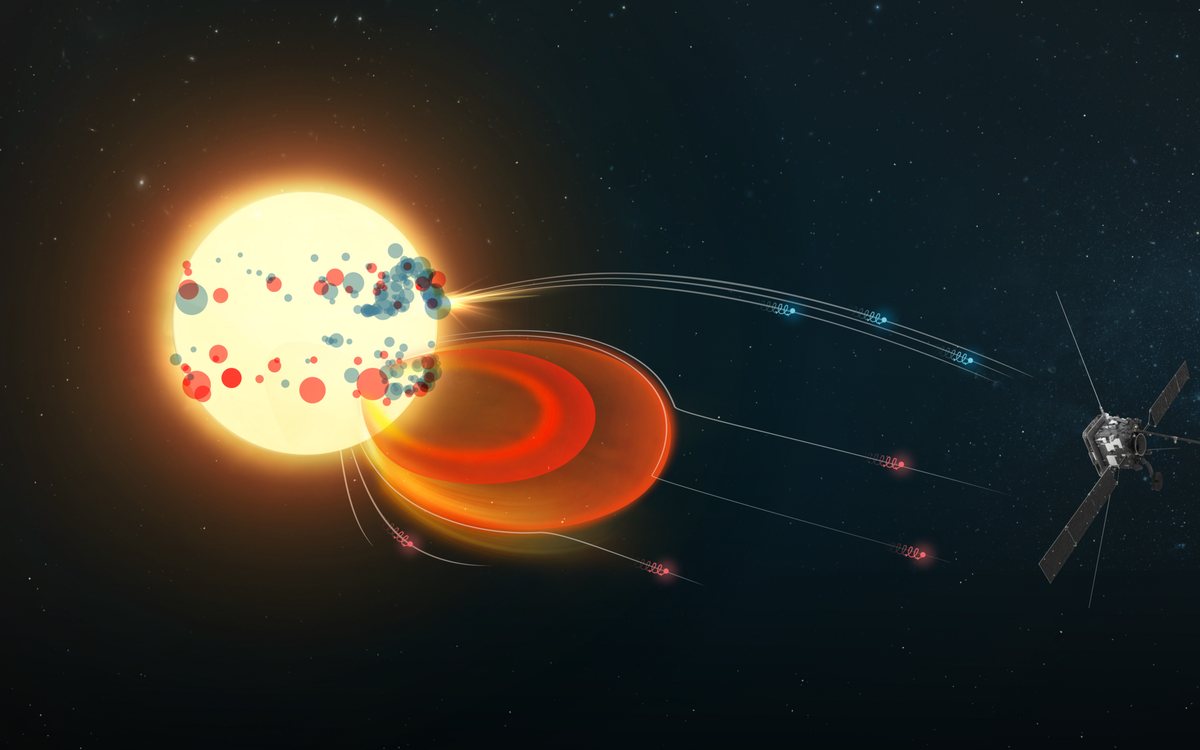
Solar Orbiter does two jobs at once: it photographs the Sun from as close as 0.28 AU with the sharpest cameras ever flown there, and it samples the wind flowing past at the same time, so what it sees and what it feels can be matched up. Each Venus flyby tips its orbit further out of the flat plane the planets live in. By the end of the decade it will look down on the Sun's poles, which no camera has ever seen.

Feeds: its position on the Spacecraft layer, with a live readout of how far above or below the ecliptic it is, and a target in the "Directed at" selector so you can ask whether a CME will hit it. Its imagery isn't used live.
Illustration. Credit: ESA, CC BY-SA 3.0 IGO, via Wikimedia Commons
Launching 2027

SunCET

LASP / JHU APL · CubeSat
Low Earth orbit

The Sun Coronal Ejection Tracker is a shoebox sized satellite with one purpose: to watch CMEs in the gap nobody covers, from the Sun's surface out to about five solar radii, where a CME does most of its accelerating. Coronagraphs like SOHO's only pick a CME up after it has left that zone. SunCET's extreme ultraviolet camera exposes the bright disk and the faint corona at the same time, so it can follow the eruption from the start.

Will feed: earlier, better launch speeds for Earth directed CMEs, which are the single biggest source of error in arrival forecasts. We've been testing its simulated data against our tracking code ahead of launch, and its card here fills in the day it sends its first image.
No image yet. It hasn't flown.

Not spacecraft, still sources

A few of the numbers on the site come from people and institutions rather than directly from a satellite.

NASA DONKI Analysts at NASA's Community Coordinated Modeling Center look at every CME in the SOHO and STEREO images and record its speed, direction and width. That catalog is the input to every arrival estimate here.
NOAA SWPC The Space Weather Prediction Center runs the real time feeds this site reads every few minutes: solar wind from L1, X-rays and protons from GOES, the Kp index and the official G, S and R scales.
GFZ Potsdam & OMNI The definitive Kp index comes from GFZ in Germany, computed from ground magnetometers. Historical solar wind for the replays and the wind archive comes from NASA's OMNI database, which merges decades of L1 measurements.
Helioviewer A NASA and ESA archive of solar imagery. When you scrub the timeline into the past, the Sun panel's SDO frame comes from here.

The arrival times themselves are ours: a drag based model run on those measurements, scored honestly against what really happened. How well it does →

Why this matters

Space weather is one of the few fields where the raw data from billion dollar missions is public within minutes. This site is one example of what that openness makes possible: a working storm tracker built by one person from the same feeds the professionals use. If you teach, the six module course walks through how these measurements turn into a forecast. If you want the data yourself, the data sources page links every feed.

© 2026 Mike DiCarlo · CME Tracker · Privacy · 𝕏 @CMETracker1