How forecasting works
Three instruments, in order of warning time: coronagraphs that see the launch days out, a physics model that turns launch speed into an arrival, and the L1 monitor that turns the last hour from a forecast into a measurement.
The idea
A fast CME plows into the slower solar wind ahead of it and decelerates, like a boat pushing through water. Feed the model a launch speed, a direction and the wind it must push through, and physics gives an arrival time. The catch is that the wind changes daily and a head-on CME's speed is hard to measure. That is where the error bars come from.
The launch speed and direction come from coronagraphs: telescopes with a disk that blots out the Sun, so the faint cloud around it shows. What they see depends on where the cloud is going.
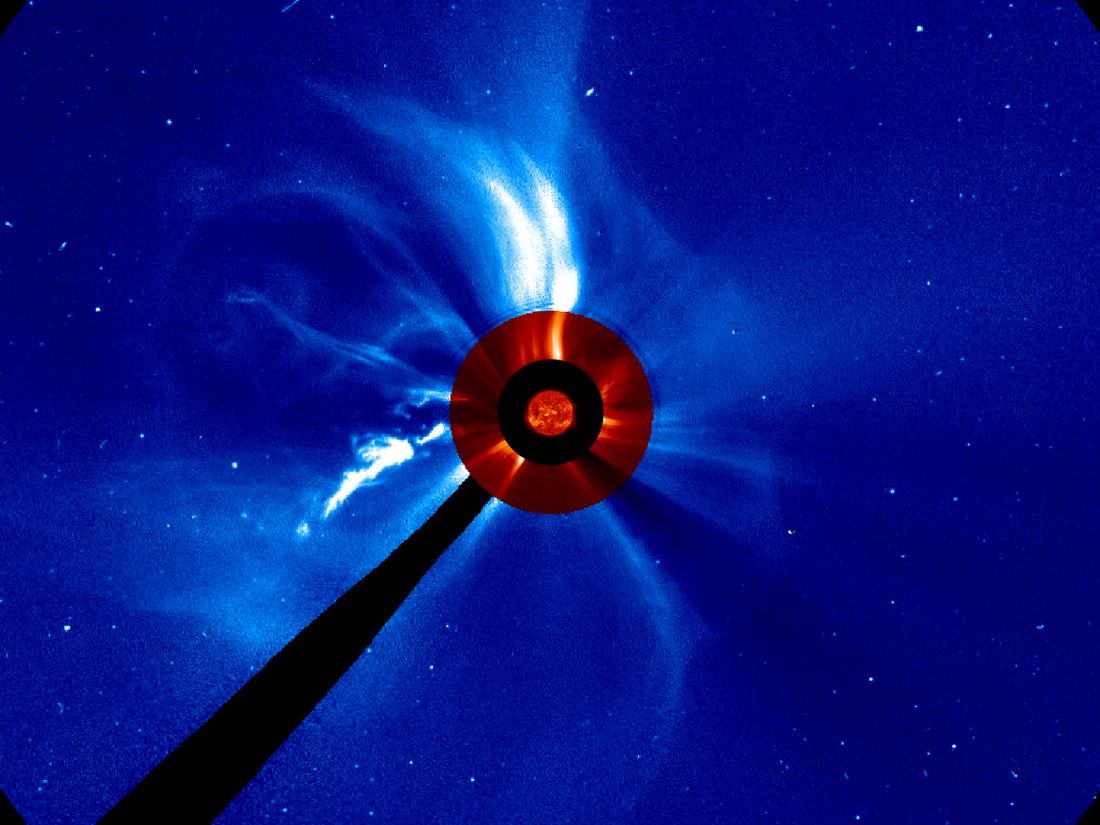 the Sun
the CME, side-on
arm that holds the mask
the Sun
the CME, side-on
arm that holds the mask
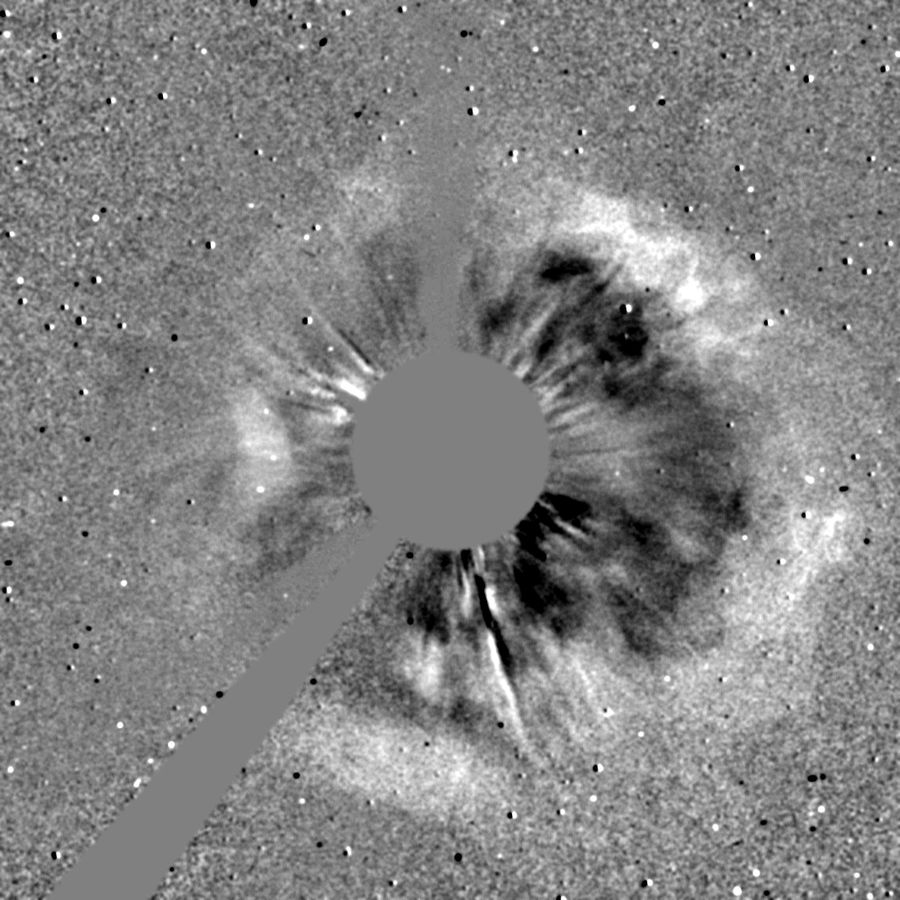 the Sun, hidden
the halo
the Sun, hidden
the halo
Turn the dial
Same CME, same launch. Change only the wind it must push through and watch the arrival move.
Loading the forecast…
How often is it right?
Every arrival estimate on this site comes from that model. Here is its scorecard against real measured arrivals, misses included.
Twelve hours is the median. The mean is about fifteen, and roughly a third of arrivals miss by eighteen hours or more, so the tails are wide. That is the state of the field, not a shortcut. Arrival is physics on speed and distance. Storm strength is a different question: it hinges on the field direction inside the cloud, the Bz from Module 1, and nobody can read that until the last hour. The science page has the full validation.
Aim has two parts
One more thing decides a forecast before any arrival time matters: does it hit at all? Here is another CME from the same week, alone, seen from straight above the solar system, the way the flat map shows it. Your call: will it hit Earth?
A flat map can only show one of the two angles NASA measures. Left to right is longitude, and this CME's longitude was dead on. Up and down is latitude, and that is where it missed. The tracker's 3D view exists for exactly this, and it is why the card for a CME can say "misses Earth" under a wedge that seems to cover it.